How to convert a S&T into Project Network and view it as Gantt chart?

Once the Planning details for all the lowest level nodes are completed, you can convert your S&T to a Project Network and view it as a Gantt Chart.
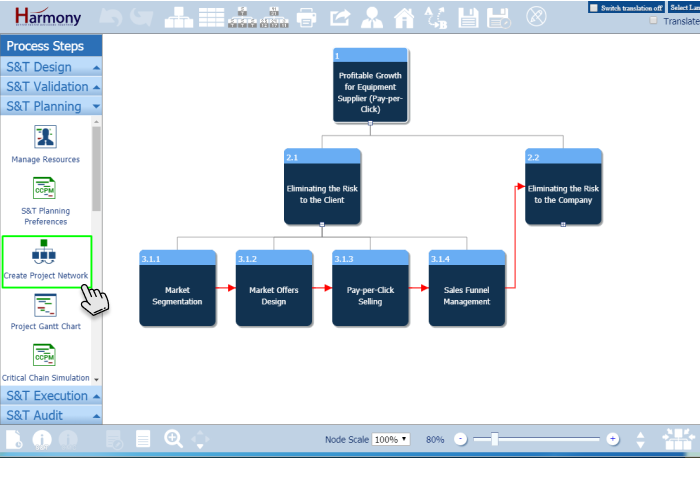
  1. Click on “Create Project Network” to convert your S&T to a Project Network and view it as a Gantt Chart.
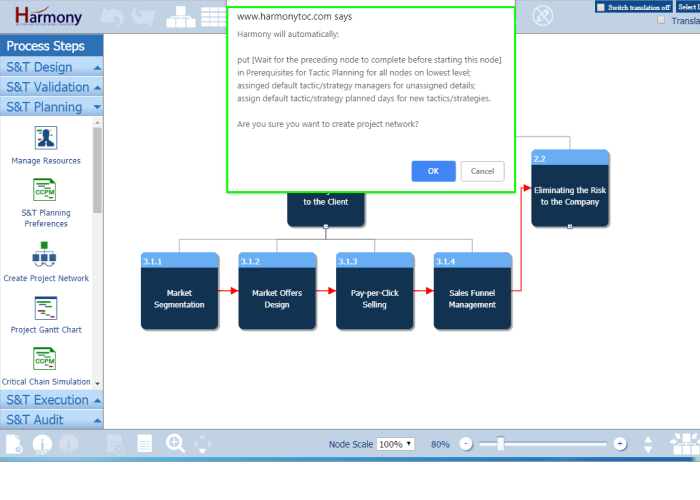
  2. Harmony will confirm before converting your S&T tree to a Project Network.
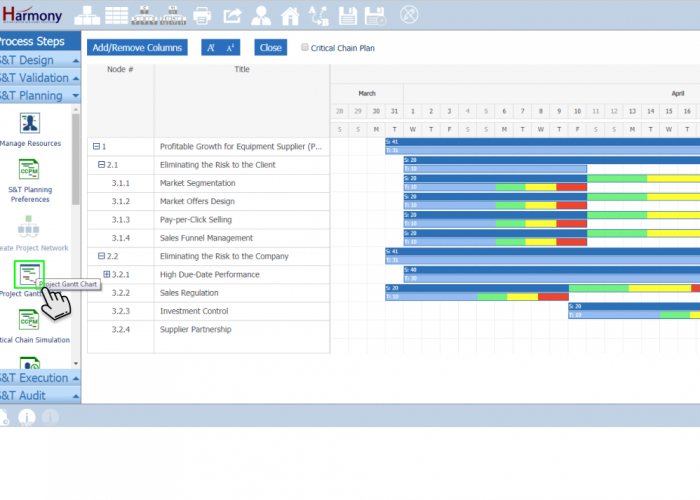
  3. Click on “Project Gantt Chart” to view your S&T as a Gantt Chart.
  • 1. Click on "Create Project Network" to convert your S&T to a Project Network and view it as a Gantt Chart.
Your S&T Project Gantt Chart in Harmony is different from a traditional Gantt because it will show the time estimate for both the Strategy achievement and Tactic implementation time estimates for each level, which are often not the same. Example: A Strategy ‘Reduce WIP by 20%’ have a Tactic ‘Implement Dynamic Buffer Management’. In this case, the Tactic may only take a 20 days to implement, but the time to realize the full effect for the strategy might take a full inventory cycle of say 60 days.